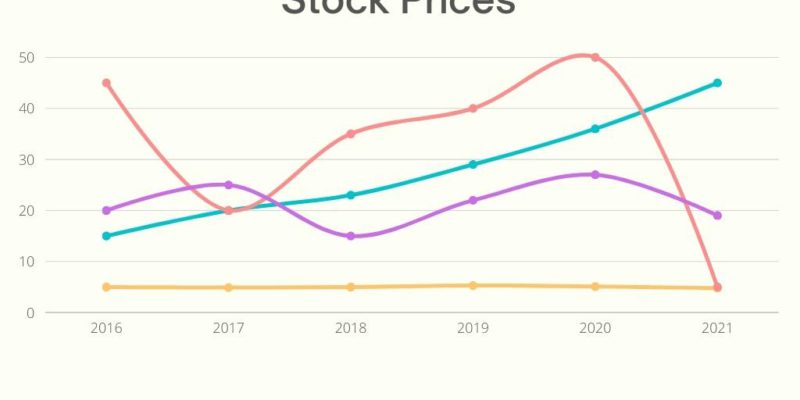
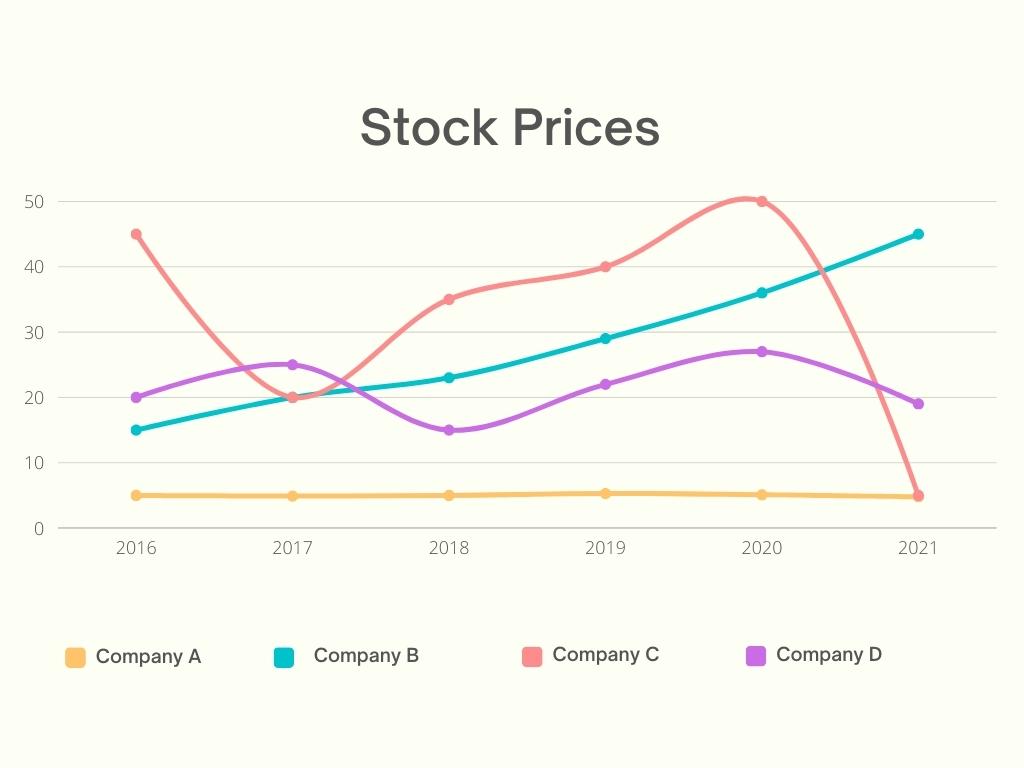
The chart presented above displays the stock value of four technology corporations from 2016 to 2021.
Summarise the information by selecting and reporting the main features, and make comparisons where relevant.
Sample response:
The above line graph illustrates the stock prices of four technology firms during the years 2016 to 2021. Overall, the four stocks moved in different directions and exhibited distinct patterns over the course of the six-year period.
The most volatile movement of the period was recorded on Company C. In 2016, its stock had the highest per share value among the four, with each share priced at 46 dollars. In the following year, its stock price dropped by more than half to 20 dollars, which was followed by a gradual three-year recovery until it reached its peak at 50 dollars in 2020. However, in the next year, it plummeted from its highest price point to 5 dollars. This 90% decline in market value made each stock share of Company C worth as much as that of Company A, which remained at roughly 5 dollars throughout the period with negligible fluctuations.
Originally ranked third in per-share price at the beginning of the period, the stock value of Company B steadily increased threefold from 15 dollars to approximately 45 dollars in 2021, making it the top-ranked company in terms of market valuation. Company D, in contrast, remained at 20 dollars at the end of the period after fluctuating between 25 dollars to 15 dollars during the years.


Comments